Click here for the interactive version of this map.
This guest post comes our way from Scott Jedlicka, an assistant professor of Sport Management at Washington State University. When he’s not tinkering with data visualization or playing with his baby son, Scott’s work addresses a range of issues concerning sports governance and diplomacy. Follow him @scottrjed.
As the majority of higher education institutions across America grapple with the complex challenges of resuming in-person instruction in a few months, one particularly vexing issue confronting many colleges and universities is the feasibility of playing intercollegiate football during a global pandemic. The sports world is only now beginning to reopen, with individual sports for which social distancing does not pose a major obstacle—golf, stock car racing, rodeo—leading the way. The conditions under which the resumption of major American team sports like baseball and football might be possible are complicated (at best), if indeed resumption is possible at all. Nonetheless, many college athletic departments are sustained by the revenue generated from playing football, and the economies of many college towns rely heavily on the spending that takes place during football weekends. There is definite urgency to find a workable solution.
Of course, the rush to restart the economic engines like college football may end up being a prelude to our “darkest winter in modern history”. As states begin to roll back shelter-in-place orders, despite many failing to meet federal guidelines for doing so, there is legitimate concern that American lives will be needlessly sacrificed on the altar of commerce and entertainment. In our effort to “get back to normal” (an effort in which football and other popular sports ostensibly play a key role), we may instead create for ourselves a much more dire and tragic—and certainly, abnormal—situation.
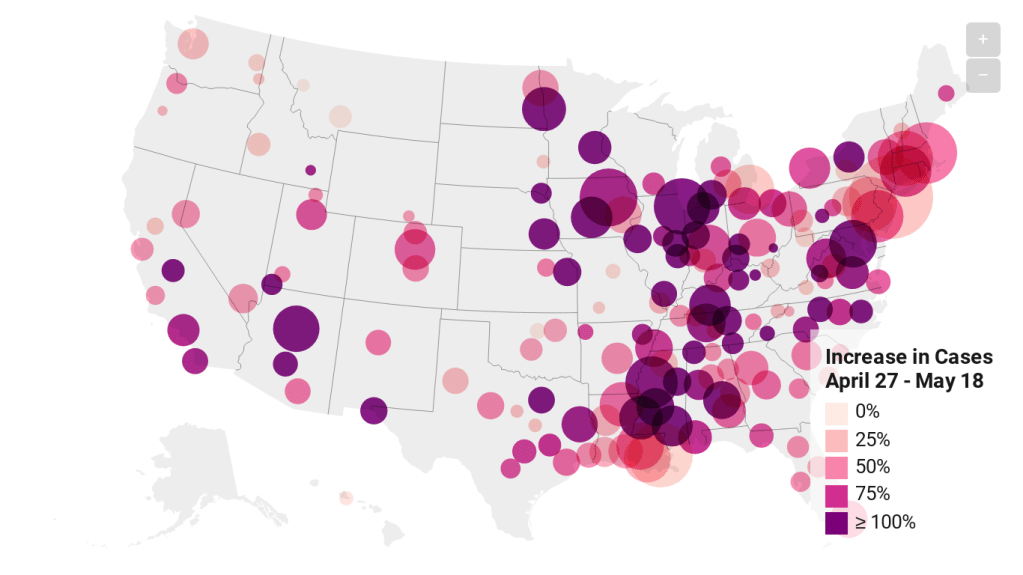
There are no easy answers here, but clear-eyed analysis can and should guide decision-making. To this end, this map is my effort to visualize COVID-19’s prevalence in areas where college football might be played this fall, as well as to represent recent trends in confirmed cases and fatalities. What follows are a few notes on how the visualization was constructed and the information it contains. The map will be updated daily as the COVID-19 data is made publicly available.
Each location marker uses data for the corresponding combined statistical area (CSA), which the US Census Bureau defines as “groupings of adjacent metropolitan and/or micropolitan statistical areas that have social and economic ties as measured by commuting to work” that “can be characterized as representing larger regions that reflect wider-ranging social and economic interactions, such as wholesaling, commodity distribution, and weekend recreation activities, as well as lower levels of daily commuting interaction.” In short, CSAs encompass more completely the flow of people and goods in a particular region. If we are concerned about the spread of a highly-contagious virus, data for CSAs paint a more comprehensive picture than data for individual counties, cities, or even states.
The size of each marker indicates the number of cases per 100,000 people for the CSA. Since this is a standardized measure, it provides an apples-to-apples comparison of COVID-19’s prevalence across CSAs of different sizes. Each marker’s color indicates (as noted in the map legend) the percent increase in cases over the preceding three weeks. As of this writing, most of the 164 CSAs in the dataset are within the 0% – 100% range (there’s more to say on the reasoning behind setting this range, but I won’t delve into it here). The three-week window is somewhat arbitrary. Intuitively, it seems long enough to smooth out any daily blips, but short enough to indicate meaningful shifts in one direction or the other.
Finally—scrolling over each marker will display:
- The name of the CSA
- The school(s) located in the CSA
- Confirmed cases and deaths per 100,000 people
- Percentage increases in confirmed cases and deaths over the preceding three weeks
In a little over 100 days, the 2020 college football season is scheduled to kick off. University presidents, athletic directors, faculty, students, and fans will be monitoring the situation (and hopefully, the data) closely. Like all data, the information presented here is not, in itself, prescriptive; numbers cannot tell us what to do. However, they can help us to decide what to do, whether that takes the form of socially-distanced tailgating, playing games in empty stadiums, or even not playing at all.
